Lately i've been playing around a lot with the Go language, and wanted to put it something together which is somehow related to the graphics part of the language. Mandelbrot image set generator was a well suited candidate for this task, because of the calculation complexity and the iteration count used to generate the fractal image, Go being a language capable to communicate and share different pools of resources via channels and goroutines.
The goroutine is used when i'm iterating over the two dimensional array, defined as a 2d system coordinate and applying the mathematical calculation prior to generate the mandelbrot set. The mandelbrot set is generated by applying a mathematical function to each complex number projected in the complex plane and determining for each whether they are bounded or escapes towards infinity.
The mandelbrot is defined by the following formula: z_{n+1} = z_n^2 + c.. For example, letting c = 1 gives the sequence 0, 1, 2, 5, 26,…, which tends to infinity. As this sequence is unbounded, 1 is not an element of the Mandelbrot set. On the other hand, c = -1 gives the sequence 0, -1, 0, -1, 0,…, which is bounded, and so -1 belongs to the Mandelbrot set.
for iy := 0; iy < height; iy++ {
	waitGroup.Add(1)
	go func(iy int) {
		defer waitGroup.Done()

		for ix := 0; ix < width; ix++ {
			var x float64 = xmin + (xmax-xmin)*float64(ix)/float64(width-1)
			var y float64 = ymin + (ymax-ymin)*float64(iy)/float64(height-1)
			norm, it := mandelIteration(x, y, maxIteration)
			iteration := float64(maxIteration-it) + math.Log(norm)

			if (int(math.Abs(iteration)) < len(colors)-1) {
				color1 := colors[int(math.Abs(iteration))]
				color2 := colors[int(math.Abs(iteration))+1]
				color := linearInterpolation(RGBAToUint(color1), RGBAToUint(color2), uint32(iteration))

				image.Set(ix, iy, Uint32ToRGBA(color))
			}
		}
	}(iy)
}
After applying the mathematical function to the same point projected in the complex plane infinite number of times we can check if its bounded or escapes towards infinity. If it's bounded the iteration is restarted again.
The mandelbrot function translated into Go code is looking like this:
func mandelIteration(cx, cy float64, maxIter int) (float64, int) {
	var x, y, xx, yy float64 = 0.0, 0.0, 0.0, 0.0

	for i := 0; i < maxIter; i++ { xy := x * y xx = x * x yy = y * y if xx+yy > 4 {
			return xx + yy, i
		}
		x = xx - yy + cx
		y = 2*xy + cy
	}

	log_zn := (x*x + y*y) / 2
	return log_zn, maxIter
}
Treating the real and imaginary parts of each number as image coordinates, pixels are colored according to how rapidly the sequence diverges, if at all. For smooth color interpolation i've used Paul Burke's cosine interpolation algorithm:
func cosineInterpolation(c1, c2, mu float64) float64 {
	mu2 := (1 - math.Cos(mu*math.Pi)) / 2.0
	return c1*(1-mu2) + c2*mu2
}
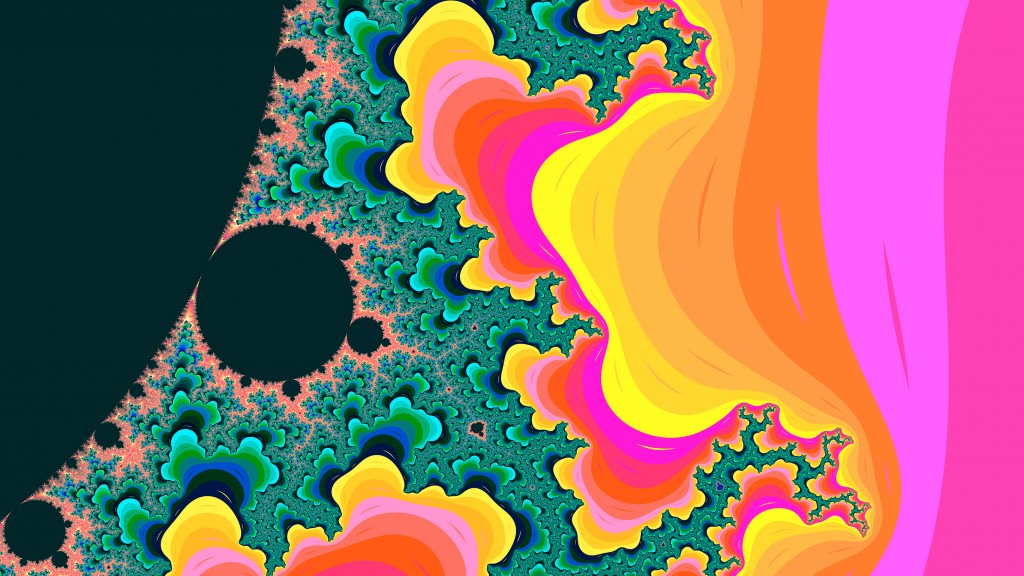
The larger and scattered the color palette used the more intense and vivid the generated mandelbrot image is. By combining the following flag values: -step, -palette and -iteration you can obtain differently colorized mandelbrot sets, like in the screenshot below:
Because the rendering process could take some time, depending on the image resolution, the image smoothness and the iteration count, i thought that it would be a good idea to visualize the background process in terminal. For this purpose a good option was to use a different channel and signaling a tick on specified intervals. time.Tick is at rescue! On another channel i'm processing the image and when the rendering has been finished i'm sending a done signal to main goroutine, telling that the rendering process has been finished, which means i could stop the background indicator process.
done := make(chan struct{})
ticker := time.NewTicker(time.Millisecond * 100)

go func() {
	for {
		select {
		case <-ticker.C:
			fmt.Print(".")
		case <-done:
			ticker.Stop()
			fmt.Print("Done!")
			fmt.Printf("\n\nMandelbrot set rendered into `%s`\n", outputFile)
		}
	}
}()
Install
go get github.com/esimov/gobrot
Before to run the code you need to include the project into the GOPATH environment variable. See the documentation: https://golang.org/doc/code.html#GOPATH
Run
go run mandelbrot.go --help
Will give all the options supported by the renderer at the moment.
Here are some options you can try out. (The attached images are generated using the below commands.)
- go run mandelbrot.go -palette "Hippi" -xpos -0.0091275 -ypos 0.7899912 -radius .01401245 -file "test1.png"
- go run mandelbrot.go -palette "Plan9" -xpos -0.0091275 -ypos 0.7899912 -radius .01401245 -file "test2.png" -iteration 600 -step 600
- go run mandelbrot.go -palette "Hippi" -xpos -0.00275 -ypos 0.78912 -radius .1256789 -file "test3.png" -iteration 800 -step 6000 -smoothness 10 -width 1920 -height 1080
TODO
Generate various images with a single command
Find dynamically the regions where a deep zoom will emerge new mandelbrot sets